Weather forecasting
Weather forecasting is the attempt by meteorologists to predict weather conditions that may be expected at some future time. Weather forecasting is the single most important practical reason for the existence of meteorology, the study of weather, as a science. Accurate weather forecasts help save money and lives.
Humans have been looking for ways to forecast the weather for centuries. Modern weather forecasting owes its existence to the invention of many weather recording instruments, such as the hygrometer, barometer, weather balloon, and radar. Three major technological developments have led weather forecasting to its current status: the development of instant communications with distant areas beginning in the late 1800s, remote sensing devices starting in the early 1900s, and computers in the late 1900s.
Weather recording instruments
In the fifteenth century, Italian artist and scientists Leonardo da Vinci (1452–1519) invented the hygrometer (pronounced hi-GROM-e-ter), an instrument that measures atmospheric humidity (moisture in the air). Around 1643, Italian physicist Evangelista Torricelli (1608–1647) created the barometer to measure air pressure differences. These instruments have been improved upon and refined many times since.
Weather information has long been displayed in map form. In 1686, English astronomer Edmond Halley (1656–1742) drafted a map to explain regular winds, tradewinds, and monsoons. Nearly 200 years later, in 1863, French astronomer Edme Hippolyte Marie-Davy published the first isobar maps, which have lines (isobars) connecting places having the same barometric pressure.
Weather data allowed scientists to try to forecast what the weather would be at some later time. In 1870, the U.S. Weather Service was established under the supervision of meteorologist Cleveland Abbe (1838–1916), often called America's first weatherman. Networks of telegraphs made it possible to collect and share weather reports and predictions. By the twentieth century, the telephone and radar further increased meteorologists' ability to collect and exchange information.
Remote sensing (the ability to collect information from unmanned sources) originated with the invention of the weather balloon by French meteorologist Léon Teisserenc de Bort (1855–1913) near the beginning of the twentieth century. Designed to make simple preflight tests of wind patterns, these balloons were eventually used as complete floating weather stations with the addition of a radio transmitter to the balloon's instruments.
Scientific advances
Many scientists added to the pool of meteorological knowledge. During World War I (1914–18), the father-son team of Vilhelm and Jacob
Bjerknes organized a nationwide weather-observing system in their native Norway. With the data available, they formulated the theory of polar fronts: the atmosphere is made up of cold air masses near the poles and warm air masses near the tropics, and fronts exist where these air masses meet.
During World War II (1939–45), American military pilots flying above the Pacific Ocean discovered a strong stream of air rapidly flowing from west to east, which became known as the jet stream.
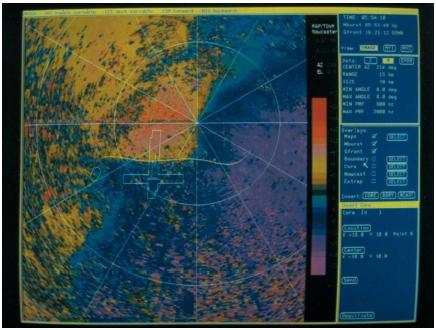
The development of radar, rockets, and satellites greatly improved data collection. Weather radar first came into use in the United States in 1949 with the efforts of Horace Byers (1906–1998) and Roscoe R. Braham. Conventional weather radar shows the location and intensity of precipitation. In the 1990s, the more advanced Doppler radar, which can continuously measure wind speed and precipitation, came into wide use.
Daily Weather Map
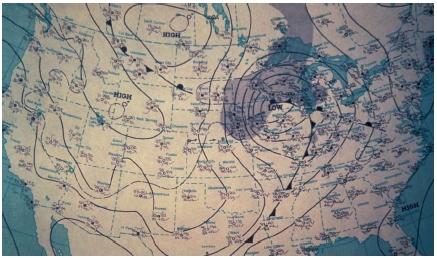
The weather map that appears in daily newspapers can be used to predict with some degree of accuracy weather conditions in the next few days. The major features of the daily weather map include isobars and high and low pressure areas.
An isobar is a line connecting locations with the same barometric pressure. Isobars often enclose regions of high or low pressure, indicated on the map as H or L. The outer edge of an isobar marks a front. The nature of the front is indicated by means of solid triangles, solid half-circles, or a combination of the two. An isobar with solid triangles attached represents a cold front; one with solid half-circles, a warm front; one with triangles and half-circles on opposite sides, a stationary front.
The daily weather map also may include simplified symbols that indicate weather conditions. A T enclosed in a circle may stand for thunderstorms, an F for fog, and a Z for freezing rain. Precipitation (rain, showers, snow, flurries, ice) is often represented by different designs, such as small circles, stars, and slash marks. Differences in sunshine and cloudiness are often represented by differently shaded areas.
Calculators and computers make it possible for meteorologists to process large amounts of data and make complex calculations quickly. Weather satellites, first launched in 1960, can now produce photographs showing cloud and frontal movements, water-vapor concentrations, and temperature changes.
Long-range forecasting
Because of the complexity of atmosphere conditions, long-range weather forecasting remains an elusive target. Usual forecasts do not extend beyond a week to ten days. This reality does not prevent meteorologists from attempting to make long-term forecasts. These forecasts might predict the weather a few weeks, a few months, or even a year in advance. One of the best known (although not necessarily the most accurate) of long-term forecasts is found in the annual edition of the Farmer's Almanac.
[ See also Air masses and fronts ; Atmosphere, composition and structure ; Atmospheric circulation ; Atmospheric pressure ; Global climate ; Weather ]
Comment about this article, ask questions, or add new information about this topic: