Remote Sensing - Real-life applications
Photogeology
All of these innovations introduced by the military, of course, have found application for civilian purposes. Thanks in part to improvements in aircraft during World War II, for instance, photogeologic data gathering has increased dramatically in the years since then. Efforts at gaining information by means of airborne sensing devices underwent enormous improvements throughout the middle and latter part of the twentieth century, with the development of technology that made it possible for earth scientists to gather information using techniques beyond ordinary photography, visible light, and airplanes.
Still, much of the remote-sensing activity that takes place today is performed aboard airplanes rather than satellites, using ordinary analogue photography within the visible spectrum. Stereoscopic techniques aid in the visualization of relief, or elevation and other in equalities on a land surface. Humans are used to seeing stereoscopically: the distance between the two eyes on our faces results in a difference between the two images each eye sees. The brain corrects for this difference, rendering a stereoscopic image that is more full and dimensional than anything a single eye could produce. The use of multiple cameras and stereoscopic technology replicates this activity of the human brain and thus provides earth scientists with much more information than they could gain simply by looking at "flat" photographs taken from an airplane.
The materials studied by a geologist, of course, are primarily underground, but Earth's surface furnishes many clues that a trained observer can interpret. Uplands and lowlands tend to suggest different types of rocks, while the direction of a dip in the land can supply volumes of information regarding the stratigraphic characteristics of the region. The presence of vegetation can make it harder to discern such clues, but a careful study of plant life can reveal much regarding minerals in the soil, local water resources, and so on.
Digital Photography
Within both photogeology and the larger realm of remote sensing, several innovations from the 1960s onward have underpinned more effective methods of observation. One of these is digital photography, which is as much of an improvement over old-fashioned photography as compact discs are over phonograph records. In both cases, the contrast is between analog technology and digital technology. In analog photography,
An analogue (the preferred spelling for the word as a noun) is just that, a "close copy," whereas digital methods make possible a more exact reproduction of images by assigning to each shade of color a number between 0 and 255. Instead of storing the image in a medium that can be destroyed or lost easily, as is the case with ordinary film, digital images can be saved on a computer, backed up, and sent anywhere in the world via the Internet. Furthermore, these images can be adjusted with the use of a computer, so as to make it easier to see certain features.
Computers and digital photography aid in the creation of false-color imaging, a means of representing invisible electromagnetic data by assigning specific colors to certain wavelengths. An example would be the use of red to depict areas of high energy. This is certainly a false use of color, since red actually has the lowest energy
RADAR.
Most remote-sensing technology uses light, whether infrared or visible, that falls at the middle to high end of the electromagnetic spectrum. By contrast, at least one important means of remote detection uses microwaves, which are much lower in energy levels. Microwaves carry FM radio and television signals, as well as radar, or RA dio D etection A nd R anging.
Radar makes it possible for pilots to "see" through clouds, rain, fog, and all manner of natural phenomena—not least of which is darkness. It also can identify objects, both natural and man-made, on the ground. In addition to its application in remote sensing, radar using the Doppler effect (the change in the observed frequency of a wave when the source of the wave is moving with respect to the observer) helps meteorologists track storms.
In the simplest model of radar operation, a sensing unit sends out microwaves toward the target, and the waves bounce back off the target to the unit. In a monostatic unit—one in which the transmitter and receiver are in the same location—the radar unit has to be switched continually between sending and receiving modes. Clearly, a bistatic unit—one in which the transmitter and receiver antennas are at locations remote from one another—is generally preferable, but on an airplane, for instance, there is no choice but to use a monostatic unit.
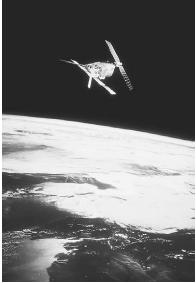
Satellite Data
The term satellite refers to any object orbiting a larger one; thus, Earth's Moon and all the other moons of the solar system are satellites, as are the many artificial satellites that orbit Earth. In practice, however, most people use the term to refer only to artificial satellites, of which there are many hundreds, launched by entities ranging from national governments to international associations to independent firms. Artificial satellites typically are intended for the purposes of gathering information (i.e., scientific research or military surveillance) or disseminating it (i.e., through satellite television broadcasting).
In launching a satellite, it is necessary to overcome the enormous pull of Earth's gravitational field. This is done by providing the satellite with power through rocket boosters that launch it far above Earth's atmosphere. At a height of 200 mi. (320 km) or more, the satellite is far above the dense gases of the atmosphere yet well within the gravitational field of the planet. The craft is then in a position to orbit Earth indefinitely without the need for additional power from man-made sources; instead, Earth's own gravitational energy keeps the satellite in orbit for as long as the satellite's structure remains intact. (See Gravity and Geodesy for more about the mechanics of orbit.)
The greater the altitude, the longer it takes a satellite to complete a single revolution. One of the most commonly used altitudes is at 22,500 mi. (36,000 km), at which height a satellite takes 24 hours to orbit Earth. Thus, it is said to be in geosynchronous orbit, meaning that it revolves at the same speed as the planet itself and therefore remains effectively stationary over a given area. Some satellites revolve at even higher altitudes—25,000 mi. (40,225 km), which, while it is far beyond the atmosphere, is well within Earth's gravitational field.
LANDSAT.
One of the most impressive undertakings in the field of satellite research is Landsat, an Earth-monitoring satellite designed specifically for the use of earth scientists and resource managers. Conceived by the United States Department of the Interior in the mid-1960s, the Landsat project soon came to involve the National Aeronautics and Space Administration (NASA) and the U.S. Geological Survey (USGS; see Measuring and Mapping Earth for more about geologic surveys.) Landsat 1 went into orbit on July 23, 1972.
Over the years, Landsat has gone into six subsequent generations. Landsat 6 , launched in 1993, was unable to achieve orbit, but Landsat 1 lasted more than five times as long as its projected life expectancy of one year. Since 1972 at least one Landsat satellite has been in orbit over Earth, and as of early 2001 both Landsat 5 (launched in March 1984) and Landsat 7 (launched in April 1999) were on line. ( Landsat 5 was decommissioned in June 2001.) Over the course of the years, the Landsat governing body has changed. In the 1980s, NOAA (National Oceanic and Atmospheric Administration) took over from NASA, and in October 1985 the Landsat system came under the direction of a commercial organization, the Earth Observation Satellite Company (EOSat).
In contrast to communication satellites, which tend to maintain geosynchronous orbits, Landsat moves at a much lower altitude and therefore orbits Earth much more quickly. Landsat 7 takes approximately 99 minutes to orbit the planet, thus making 14 circuits in a 24-hour period. Though it never quite passes over the poles, it covers the rest of Earth in swaths 115 mi. (185 km) wide, meaning that eventually it passes over virtually all other spots on the planet.
SATELLITES AT WORK.
Landsat and other satellites, such as France's SPOT (Satellite Positioning and Tracking), provide data for governments, businesses, scientific institutions, and even the general public. Following the September 11, 2001, terrorist bombing of the World Trade Center in New York City, for instance, the SPOT U.S. Web site ( <http://www.spot.com> ) provided viewers with "Images of Infamy": views of downtown Manhattan before and just a few hours after the bombing.
Data from Landsat has been used to study disasters and potential disasters with particular application to the earth sciences. An example is the area of the tropical rainforest in Brazil's Amazon River valley, a region of about 1.9 million sq. mi. (five million sq km), in which deforestation is claiming between 4,250 sq. mi. and 10,000 sq. mi. (11,000-26,000 sq km) a year. This is an extremely serious issue, because the Amazon basin represents approximately one-third of the total rain-forest area on Earth. Earlier estimates, however, had suggested that deforestation was claiming up to three times as much as it actually is, and Landsat provided a more accurate figure.
Because of its acute spatial resolution (98 ft., or 30 m, compared with more than 0.6 mi., or 1 km), Landsat is much more effective for this purpose than other satellite systems operated by NOAA or other organizations. It is also cheaper to obtain images from it than from SPOT. Over the years, Landsat has provided data on urban sprawl in areas as widely separated as Las Vegas, Nevada, and Santiago, Chile. It has offered glimpses of disasters ranging from the eruption of Mount Saint Helens, Washington, in 1980 to some of the most potent recent examples of destruction caused by humans, including the nuclear disaster at Chernobyl, Ukraine, in 1986 and the fires and other effects of the Persian Gulf War of 1990-1991. (For more on this subject, see the Earthshots Web site, operated by USGS.)
Not all the news from Landsat is bad, as a visit to the Landsat 7 Web site ( <http://landsat.gsfc.nasa.gov/> ) in late 2001 revealed. Certainly there were areas of concern, among them, flooding in Mozambique and runaway development in Denver, Colorado. But images taken over the Aldabra atoll in the Seychelles showed the world's largest refuge for giant tortoises. And shots taken from Landsat over Lake Nasser in southern Egypt during the latter part of 2000 showed four lakes created by excess water from Nasser. As a result, that region of the Sahara had new lakes for the first time in 6,000 years.
WHERE TO LEARN MORE
Burtch, Robert. A Short History of Photogrammetry (Web site). <http://users.netonecom.net/~rburtch/sure340/history.html> .
"Earthshots: Satellite Images of Environmental Change," U.S. Geological Survey (Web site). <http://edcwww.cr.usgs.gov/earthshots/slow/tableofcontent> .
Hancock, Paul L., and Brian J. Skinner. The Oxford Companion to the Earth. New York: Oxford University Press, 2000.
NASA EOS IDS Volcanology (Web site). <http://eos.pgd.hawaii.edu/> .
Remote Sensing Data and Information (Web site). <http://rsd.gsfc.nasa.gov/rsd/RemoteSensing.html> .
Skinner, Brian J., Stephen C. Porter, and Daniel B. Botkin. The Blue Planet: An Introduction to Earth System Science, 2d ed. New York: John Wiley and Sons, 1999.
Smith, David G. The Cambridge Encyclopedia of Earth Sciences. New York: Cambridge University Press, 1981.
Strain, Priscilla, and Frederick Engle. Looking at Earth. Atlanta: Turner Publishing, 1992.
Visualization of Remote Sensing Data (Web site). <http://rsd.gsfc.nasa.gov/rsd/> .
The WWW Virtual Library: Remote Sensing (Web site). <http://www.vtt.fi/aut/rs/virtual/> .
Comment about this article, ask questions, or add new information about this topic: